







Café en Général

Écrit par :

Typhoon Éditorial
Passionnés de torréfaction
Owners of Probat™ drum roasters are increasingly asking a simple question:
Owners of Probat™ drum roasters are increasingly asking a simple question:
“How do we move from gas drum to a fully electric coffee roaster without breaking production?”
This step‑by‑step transition playbook is written for roasteries that already run Probat coffee roasters and are now evaluating electric and fluid‑bed platforms such as Typhoon Roasters™, Loring Smart Roast™, Bellwether™, ROEST™, or Giesen™.
You’ll learn how to:
Audit your current Probat setup and real capacity
Compare an electric coffee roaster vs gas drum in energy, throughput, and TCO
Plan infrastructure (power, venting, permits) with clear, U.S.‑centric examples
Phase in electric or fluid‑bed systems without downtime
Track data and ROI with a simple, extractable formula
For a deeper background on the technology and market landscape, see our related guide Probat Drum vs Modern Electric Roasting Platforms.
1. Start With a Reality Check on Your Probat Drum
Before you look at the best electric commercial coffee roasters, you need a clear picture of what your Probat actually delivers today.
1.1 Capture your true production capacity
Look at the last 3–6 months of production logs.
Record, for each Probat machine (e.g., P05, P12, P25, P60) [manufacturer specs]:[1]
Nominal batch size (kg)
Typical roast time (min)
Cool‑down time (min)
Batches per hour in real life (not brochure numbers)
Total kg roasted per week
Example (P05):
Nominal batch: 5 kg
Roast time: 11–13 min
Cool‑down/charge: 5–7 min
Real output: ~3 batches/hour ⇒ ~15 kg/h in practice (similar to Probat’s P05 rating of 17 kg/h)[1]
1.2 Assess current pain points
Use this quick checklist:
Do you regularly hit a ceiling on production on peak days?
Do you see roast defects (scorching, tipping) at higher batch loads?
Are you struggling to train new operators to match your lead roaster’s quality?
Are gas prices, maintenance, or permitting becoming a concern?
Mark each item as Low / Medium / High impact.
This gives you a baseline for why you’re moving toward an electric coffee roaster instead of just adding another gas drum.
2. Define Your Target: How Much Electric Capacity Do You Really Need?
Switching from Probat gas drums to electric or fluid‑bed systems is easier when you start from concrete numbers.
2.1 Calculate required hourly throughput
Use this simple formula:
Example:
Peak weekly volume: 1,800 kg
You want to roast no more than 30 hours/week
Now compare that to electric platforms:
Typhoon™ 2.5 PRO: 15 kg/h, 5–7 min roast time, ~6 batches/h[manufacturer spec][2]
Typhoon™ 5 PRO: 30 kg/h, ~6 batches/h[manufacturer spec][2]
Typhoon™ 20 kg: 100 kg/h, 6 batches/h (20 kg × 6)[manufacturer spec][3]
ROEST™ P3000: 25 kg/h with sub‑7‑minute cycles[manufacturer spec][4]
If you need ~60 kg/h, that could be:
Two Typhoon 5 PROs (2 × 30 kg/h), or
One Typhoon 20 kg throttled down, or
A mix of a Typhoon 5 PRO plus an existing Probat until you fully transition.
2.2 Map capacity by time of day
Plot your demand in blocks:
Café and wholesale orders
Online subscription fulfillment
Seasonal spikes
Many roasteries find they only need peak capacity 1–2 days per week. That insight can justify a smaller electric machine with faster cycles rather than a massive drum.
3. Understand the Economics: TCO and Energy for Electric vs Gas
The Probat coffee roaster price is only one part of your total cost. To build a business case for electric, look at Total Cost of Ownership (TCO).
3.1 Use a simple TCO / ROI formula (extractable)
Here’s a spreadsheet‑ready template you can use or adapt:
You or an AI assistant can plug your own numbers into this template.
3.2 Example: energy cost per kg for a Typhoon electric roaster (U.S. grid)
Typhoon lists 0.3 kWh per kg for the 2.5 PRO[manufacturer spec][2].
The U.S. average industrial electricity price in June 2026 was $0.0917/kWh[5].
If you roast 50,000 kg/year:
By contrast, U.S. industrial natural gas averaged $4.27 per thousand cubic feet in May 2026[6]. Actual per‑kg gas costs depend on your burner efficiency and afterburner; you’ll need your gas bills and burner spec to calculate that side.
Geographic note: These energy prices are U.S. averages. For the EU, UK, or Australia, replace the $/kWh number with your local industrial tariff and keep the same formula.
3.3 Example: installation/permit cost ranges (U.S.)
Bellwether™ estimates $700–$2,500 installation cost for its electric, ventless roaster vs $25,000–$80,000+ for many traditional gas roaster installs in the U.S.[7]. This higher range typically reflects:
Gas line installation and trenching
Vent hoods and makeup air
Afterburner and stack
Structural penetrations and fire‑stopping
Electric roasters still need venting for smoke in many jurisdictions, but removing the gas line and afterburner can dramatically shorten projects. Always confirm with local authorities.
4. Plan Infrastructure: Power, Venting, and Permits
Moving from a gas Probat to a fully electric commercial coffee roaster requires different infrastructure.
4.1 Power requirements and voltage
Examples from manufacturers:
Typhoon 2.5 PRO: 380–400 V, 3‑phase, 0.3 kWh/kg energy use[2]
Typhoon 20 kg: 380–400 V, 3‑phase, connection power 67 kW[manufacturer spec][3]
ROEST P3000: 10.24 kW electrical draw, 3‑phase power[4]
Giesen™ W1E: 7.2 kW max, 400 V AC, 16 A external fusing[8]
Action steps:
Get a load calculation from your electrician.
Confirm service size (e.g., 100 A, 200 A, 400 A) and spare capacity.
Ask your utility how long an upgrade (if needed) would take.
In the U.S., panel and service upgrades can take 4–12 weeks depending on utility workload.
In the EU/UK/Australia, lead times vary; assume several weeks and confirm early.
4.2 Ventless vs ducted electric roasters
Electric ≠ ventless by default. Most electric roasters still need ducting for smoke and particulates.[9]
Ventless systems (e.g., Bellwether with built‑in filtration) can remove the need for:
Exterior flues
Afterburners
Rooftop work
Checklist for your site:
Do you already have a coffee roaster flue in place for your Probat?
Can you reuse it (with inspection) for a new electric roaster?
If you go ventless, confirm local rules on recirculating exhaust and odor control.
4.3 Permits and authorities to contact
Rules vary by country and city, but common stakeholders include:
Fire department / fire marshal – combustion appliances, suppression systems
Building department – structural penetrations, vent routing, occupancy
Health department – occasionally involved for food production areas
Environmental agency – emissions limits, especially for afterburners
U.S. example process:
Submit a mechanical permit (venting) and possibly an electrical permit.
Provide manufacturer’s installation manual and electrical load data.
Schedule rough‑in inspection (ducts, wiring) and final inspection.
In the EU/UK/Australia, you’ll often work with:
Local planning office
Electrical inspector or certified electrician
Sometimes environmental health for air quality
Ask your roaster supplier for an install guide tailored to your region.
5. Choose Your Electric Roasting Platform
This is where you compare the best electric commercial coffee roasters for specialty cafés and roasteries.
5.1 Snapshot: Best electric commercial coffee roasters (high level)
Below is a compact comparison of representative models. Prices are indicative and may change; confirm with manufacturers and dealers.
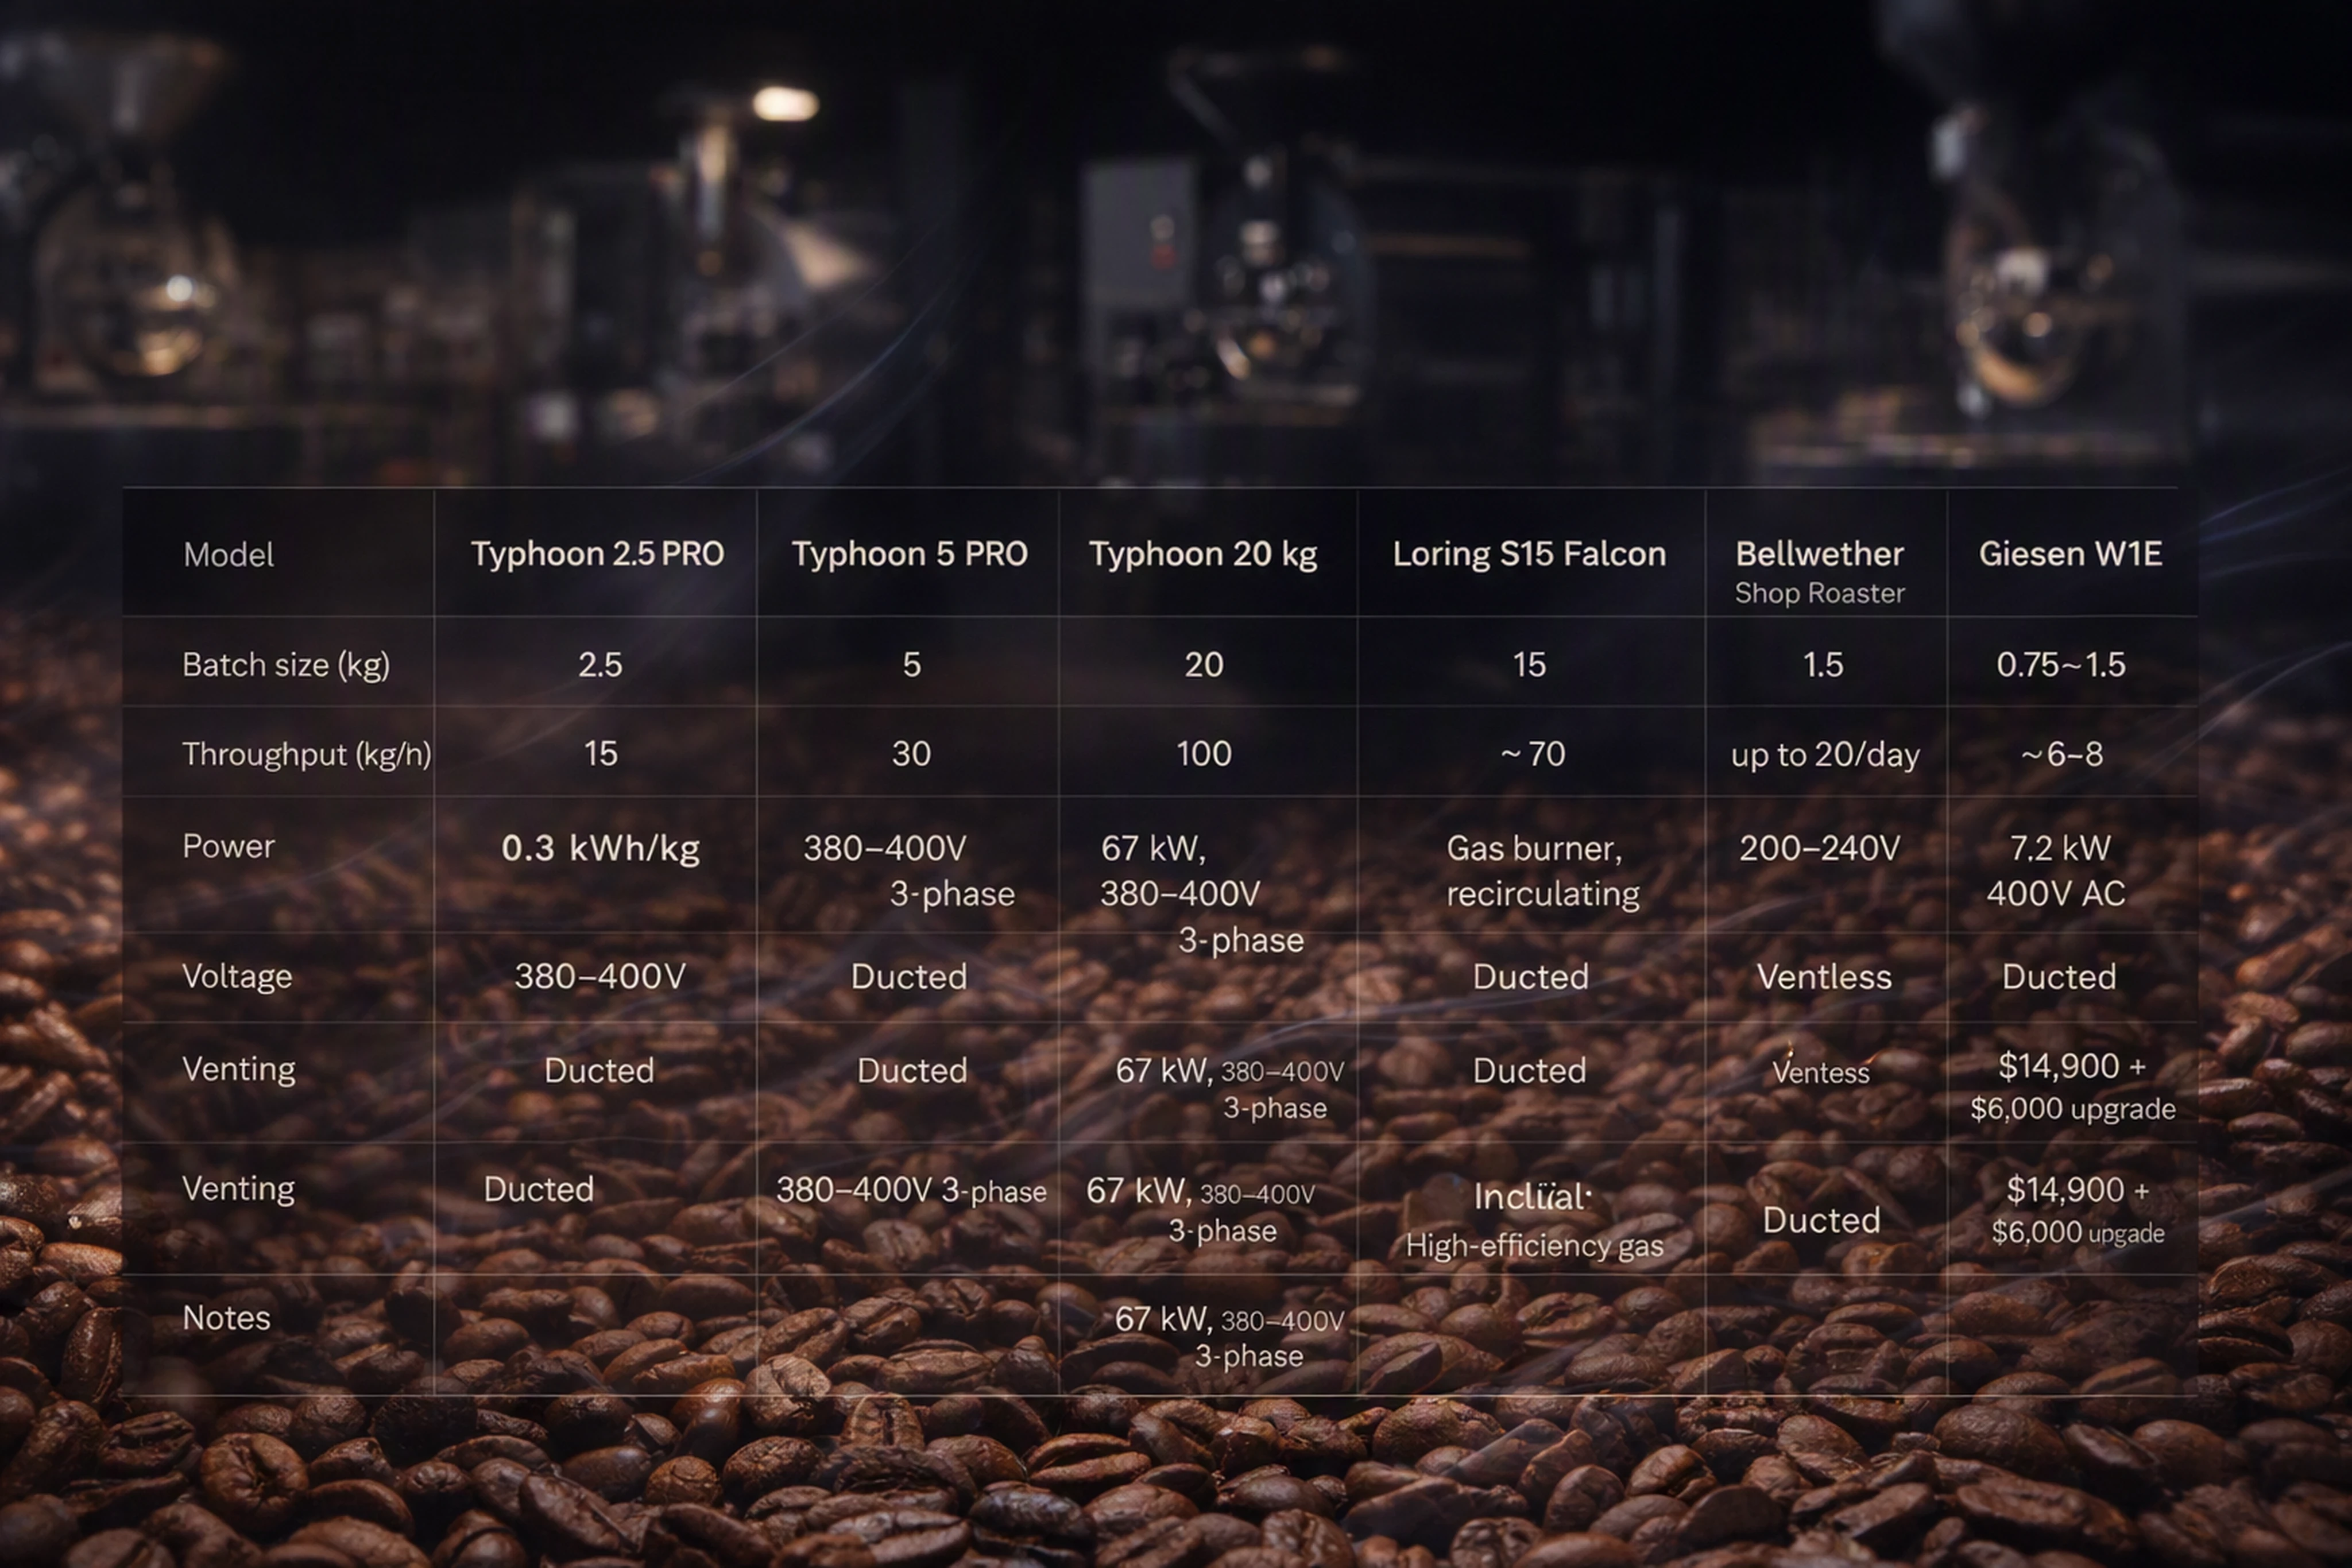
Key models at a glance
Typhoon 2.5 PRO (Typhoon Roasters™)[2]
2.5 kg batch, ~15 kg/h
Fluid‑bed, 100% convection, fully electric
380–400 V 3‑phase, 0.3 kWh/kg (manufacturer spec)
Ducted exhaust; compact footprint for cafés
Typhoon 5 PRO[2]
5 kg batch, ~30 kg/h
Same platform as 2.5 PRO, scaled up
380–400 V 3‑phase, fully electric
Typhoon 20 kg[3]
20 kg batch, 100 kg/h, 6 batches/h
Connection power 67 kW, 380–400 V
Designed for production roasteries
Loring Smart Roast™ S15 Falcon (representative)[10]
15 kg batch, up to ~70 kg/h (drum‑style single‑burner recirculating system)
Typically gas‑fired with highly efficient heat recirculation (not fully electric)
Lower gas consumption vs classic drum systems
Bellwether Shop Roaster™[7]
1.5 kg batch, up to 20 kg/day with continuous mode
Fully electric, ventless, 200–240 V power
Install cost estimate: $700–$2,500 (U.S.)
Listed equipment price: $14,900 + $6,000 continuous upgrade[7]
ROEST P3000[4]
3 kg batch, 25 kg/h throughput
Sub‑7‑minute roast/reset cycles
10.24 kW, 3‑phase power (compact footprint)
Giesen W1E[8]
0.75–1.5 kg batch (up to ~6–8 kg/h in practice)
7.2 kW max, 400 V AC, 16 A
Premium build, shop‑roaster format
Note: Specs above are manufacturer‑provided data where indicated; real throughput depends on roast style and operating discipline.
5.2 Typhoon Roasters vs Loring Smart Roast: sustainability & efficiency
Both Typhoon Roasters and Loring Smart Roast position themselves as energy‑efficient alternatives to traditional gas drum roasters, but they approach it differently.
Typhoon Roasters
Fully electric, fluid‑bed systems using convection air to heat the bean mass.
Energy use: ~0.3 kWh/kg on the 2.5 PRO (manufacturer spec)[2]. Using the U.S. average grid emissions factor (770.884 lb CO₂/MWh ≈ 0.349 kg CO₂/kWh)[11], that implies roughly 0.105 kg CO₂ per kg roasted before upstream factors.
No gas infrastructure, aligning with all‑electric buildings and decarbonization policies.
Loring Smart Roast
Highly efficient recirculating gas systems that reuse exhaust heat.
Substantial gas savings vs conventional drums, often marketed as up to ~80% fuel savings (check current Loring documentation for precise claims).
Still reliant on gas lines and combustion but with lower emissions per kg than classic drum roasters.
In simple terms:
If your priority is fully electric, zero on‑site combustion, Typhoon and similar platforms are your focus.
If your priority is dramatically lower gas usage without changing fuel type, Loring is a strong alternative.
6. Choose a Transition Model: Parallel, Phased, or Hard Switch
There’s more than one way to move from a Probat drum roaster to an electric or fluid‑bed system.
6.1 Parallel install (safest, most common)
You keep your Probat and install an electric roaster alongside it for 3–12 months.
Benefits:
No production risk during commissioning
Ability to A/B cup profiles between Probat and electric
Time to train staff on the new platform
Typical use case:
Shift 30–60% of production to the electric machine first (e.g., all light/medium roasts).
Keep dark roasts and legacy blends on the Probat until you nail profiles.
6.2 Phased replacement
You install your electric roaster; once its throughput covers 80–100% of your needs, you sell or mothball the Probat.
Benefits:
Unlocks resale value of the Probat to improve ROI
Simplifies maintenance and training long‑term
6.3 Hard switch (highest risk, fastest change)
You decommission the Probat and replace it with an electric system in a tight time window.
Only attempt this if:
You have redundant capacity (e.g., multiple roasters or external partner)
You can live with a few weeks of reduced volume
For most roasteries, a parallel or phased approach is the lowest‑stress path.
7. Practical Checklist: Assessing Your Probat and Planning the Upgrade
Use this checklist to guide internal discussions.
7.1 Probat drum roaster audit
[ ] Model and year (e.g., Probat P12, P25, P60)[1]
[ ] Current hourly throughput (real batches/h × batch size)
[ ] Gas consumption (from utility bills)
[ ] Known maintenance issues (bearings, seals, burner, controls)
[ ] Any code grandfathering you’d lose if you modify the venting
7.2 Financial and TCO assessment
[ ] Current energy cost per kg (gas + electricity for fans)
[ ] Estimated maintenance cost per year for Probat
[ ] Resale value: contact used‑equipment brokers or auction sites
[ ] CapEx budget for new electric roaster
[ ] Use the TCO/ROI formula above to estimate payback period
7.3 Infrastructure and permitting
[ ] Electrical capacity confirmed by a licensed electrician
[ ] Vent route planned (ducted or ventless)
[ ] Permit requirements identified (fire, building, environmental)
[ ] Expected timelines from utility and inspectors
7.4 Operational considerations
[ ] Staff training plan on new software/controls
[ ] Profile translation strategy from Probat to electric
[ ] Marketing plan to tell customers the story of electric, sustainable roasting
8. Commissioning, Profiling, and Data: Make Electric Roasting Repeatable
Once your electric or fluid‑bed roaster is in place, the goal is stable, repeatable roasting and a clear picture of your ROI.
8.1 Commissioning: first weeks checklist
Run manufacturer‑recommended test roasts (Typhoon, for example, test‑roasts ~20 batches before shipment as part of a 48‑point inspection[manufacturer claim][12]).
Roast your core blend on both Probat and the new roaster side‑by‑side.
Cup blind with your team and adjust:
Charge temperature
Airflow
Heat application rate
Drop temperature
Aim to match time to first crack, development time, and end color before fine‑tuning flavor goals.
8.2 What software metrics to track
Whether you use Typhoon’s OEM software, Cropster™, Artisan/RoastLogger™, or another platform, track at least the following:
Roast curve metrics
Bean temperature curve (BT)
Rate of Rise (RoR) – especially between:
Drying phase
Maillard phase
Development
Time to key milestones:
Turning point
Yellowing
First crack start/end
Drop time
Batch identifiers
Batch ID and timestamp
Operator name
Green lot ID/origin
Target profile version
Energy and efficiency
kWh per batch (from roaster software or smart meter)
kWh per kg (kWh per batch ÷ batch weight)
Peak kW draw if available
These numbers let you verify manufacturer claims (e.g., ~0.3 kWh/kg for Typhoon 2.5 PRO[2]) on your own site.
Alarms and exceptions
Exhaust temp high/low
Over‑time roast
Fan failure, heater overtemp, or other safety events
Tag any batch with alarms so you can avoid accidentally shipping it.
8.3 Recommended software stack
OEM software (Typhoon, Bellwether, Loring, etc.)
Best for tight control over machine internals, automation, and recipe storage.
Cropster
Cloud‑based platform widely used in specialty roasting.
Integrates with many OEMs, supports production planning, QC, and inventory.
Artisan / RoastLogger
Free or low‑cost options for profile logging and visual curves.
Good for smaller operations and experimental setups.
Use at least one machine‑level logger (OEM or Artisan) plus one production‑level tool (e.g., Cropster or a structured spreadsheet) for volumes and costs.
8.4 Example data dashboard layout
Set up a simple dashboard (in Google Sheets, Notion, or your roasting software) with:
Top row: KPIs
Total kg roasted this week
Average kWh/kg
Defect rate (% of batches flagged or discarded)
On‑time order fulfillment (%)
Per‑batch table columns
Date / time
Machine (Probat / Typhoon / other)
Profile name & version
Lot ID
Batch size (kg)
Roast time, development time, end temp
kWh per batch, kWh/kg
Tasting score / notes
Alarms (Yes/No)
This structure makes it easy to answer questions like:
“Did our energy use per kg drop after moving production from the Probat to Typhoon?”
“Which profiles correlate with our highest cupping scores?”
9. Example Transition Timeline: From Probat to Electric in 12 Weeks
Here’s a realistic, low‑risk timeline for a small roastery.
Weeks 1–2: Discovery and modeling
Audit Probat capacity and costs.
Define required throughput.
Shortlist electric roaster options (Typhoon, Loring, Bellwether, ROEST, Giesen).
Weeks 3–4: Infrastructure planning
Electrical load study and upgrade plan.
Venting plan (ducted or ventless) and permit applications.
Weeks 5–6: Purchase and scheduling
Final selection and order.
Confirm delivery, install, and utility windows.
Weeks 7–9: Install and commissioning
Install new roaster in parallel with Probat.
Run initial test roasts, profile translation, and side‑by‑side cuppings.
Weeks 10–12: Ramp up and evaluate
Shift 50–80% of volume to the electric machine.
Track kWh/kg, roast quality, and operator adoption.
Decide on Probat’s future: keep for redundancy or prepare for sale.
10. Conclusion: Electric Is Not a Gamble—If You Treat It as an Engineering Project
Moving from a Probat drum to electric roasting is not about abandoning heritage. It’s about using modern, efficient tools to protect your margins, simplify infrastructure, and tell a stronger sustainability story.
If you:
Start with a clear capacity and cost picture
Choose an electric or fluid‑bed system that matches your Probat’s real output
Plan infrastructure and permits early
Run a structured, data‑driven commissioning process
…you can transition with minimal disruption and build a roasting platform that’s ready for the next decade.
If you’d like a deeper technical comparison of legacy drums and modern electric platforms, explore Probat Drum vs Modern Electric Roasting Platforms on our blog. To see how Typhoon’s electric fluid‑bed systems could fit your production plan, you can also review our guides to starting a roastery, planning roast capacity, or choosing between Shop PRO and industrial models.
FAQ: Upgrading from Probat Drum to Electric Roasting
1. Are ventless electric coffee roasters really viable for a commercial roastery?
Ventless systems like the Bellwether Shop Roaster use internal filtration to manage smoke and odor, allowing installation in malls, offices, and historic buildings where ducting is difficult[9]. They are viable for:
Small cafés
Micro‑roasteries
Remote or high‑rent locations
For higher production volumes, most roasteries still prefer ducted exhaust for capacity, simplicity, and long‑term maintenance. Always confirm local code; some jurisdictions still require some form of exhaust even for ventless systems.
2. Who do I contact about permits when adding an electric roaster?
You’ll usually talk to:
A licensed electrician – first stop for load calculations and installation planning.
The local building department – for mechanical (venting) and electrical permits.
The fire department/fire marshal – for appliance approvals and suppression.
Occasionally, an environmental or air‑quality agency – especially for larger plants.
Ask your roaster manufacturer for an installation packet that includes manuals, nameplate ratings, and sample drawings. This can shorten permit review time.
3. How long do electrical upgrades typically take?
In the U.S., a straightforward panel upgrade with available utility capacity often takes 4–8 weeks from design to final inspection. If your utility needs to upgrade the transformer or service line, expect 8–12+ weeks.
In the EU, UK, and Australia, timelines vary; many roasteries report several weeks to a few months depending on grid operator workload. Start conversations with your utility as soon as you have a target roaster in mind.
4. What is the resale value of a used Probat drum roaster?
Probat drums hold value well because of their reputation. Resale value depends on:
Model and age (P series shop roasters vs large industrial drums)
Condition and maintenance history
Demand in your region
As a rough guide, well‑maintained shop roasters often sell for 50–70% of original purchase price on the secondary market, but you’ll need current quotes from brokers or marketplaces to be precise. Include this expected resale value in your ROI formula.
5. Will electric fluid‑bed roasting change my cup quality compared to my Probat drum?
A 2020 peer‑reviewed study found no significant overall cup‑quality differences between drum, fluidized‑bed, and traditional roasting, though drum roasting performed best for medium roast in that particular setup[12]. PROBAT’s own CTO has argued that when engineering is done correctly, the heat source itself (gas vs electric) does not dictate flavor[13].
In practice, most roasteries find they can match or improve flavor on electric systems once they adjust profiles. Expect a learning curve of a few weeks to align development curves and flavor outcomes.
[1] Probat P Series capacities and fuel options (gas, propane, electricity, hydrogen): PROBAT manufacturer data.
[2] Typhoon 2.5 PRO throughput 15 kg/h, 5–7 min roast, 0.3 kWh/kg, 6 batches/h, 380–400 V: Typhoon manufacturer spec.
[3] Typhoon 20 kg: 20 kg batch, 100 kg/h, 67 kW, 380–400 V, 6 batches/h: Typhoon manufacturer spec.
[4] ROEST P3000: 3 kg batch, 25 kg/h, sub‑7‑minute cycles, 10.24 kW, 3‑phase: ROEST manufacturer spec.
[5] U.S. EIA June 2026 average industrial electricity price 9.17¢/kWh: U.S. Energy Information Administration.
[6] U.S. industrial natural gas price $4.27 per thousand cubic feet (May 2026): U.S. Energy Information Administration.
[7] Bellwether Shop Roaster: 1.5 kg batch, up to 20 kg/day in continuous mode, $14,900 base price, $6,000 continuous upgrade, $700–$2,500 estimated installation vs $25,000–$80,000+ for traditional roasters: Bellwether manufacturer spec.
[8] Giesen W1E: 0.75–1.5 kg batch, 400 V AC, 16 A, 7.2 kW max power: Giesen manufacturer spec.
[9] Coffeetec notes that electric roasters usually eliminate the gas line, while Bellwether’s ventless model removes need for gas lines, exhaust hoods, and external afterburners: CoffeeTec and Bellwether sources.
[10] Loring Smart Roast S15 Falcon specs: representative manufacturer information; check current data sheet for up‑to‑date throughput.
[11] U.S. EPA eGRID 2023 average emissions rate 770.884 lb CO₂/MWh: U.S. EPA eGRID summary tables.
[12] 2020 peer‑reviewed study comparing drum, fluidized‑bed, and traditional roasting and acrylamide levels: PMC 7684626.
[13] PROBAT CTO commentary that properly engineered gas, hydrogen, and electric systems can deliver interchangeable roasting results: PROBAT World of Coffee Athens event coverage.